Data has become one of the most valuable business assets in 2026. Organizations across finance, healthcare, manufacturing, retail, IT, logistics, and e-commerce rely on data to make informed decisions, improve efficiency, and drive business growth. As a result, professionals with strong analytical skills are in high demand.
Three of the most popular skills in this domain are Advanced Excel, Power BI, and Data Analytics. While they are closely related, each serves a different purpose and offers unique career opportunities.
If you’re wondering “Which course should I learn first?”, this guide compares Advanced Excel, Power BI, and Data Analytics based on syllabus, difficulty level, job roles, salary, industry demand, and future career prospects.
Why Data Skills Matter in 2026
Modern businesses generate vast amounts of data every day. Employers need professionals who can:
- Organize business data
- Analyze trends
- Build dashboards
- Generate reports
- Support business decisions
- Automate repetitive reporting
- Visualize complex information
- Improve operational efficiency
Learning the right analytical tools helps you stay competitive in today’s job market.
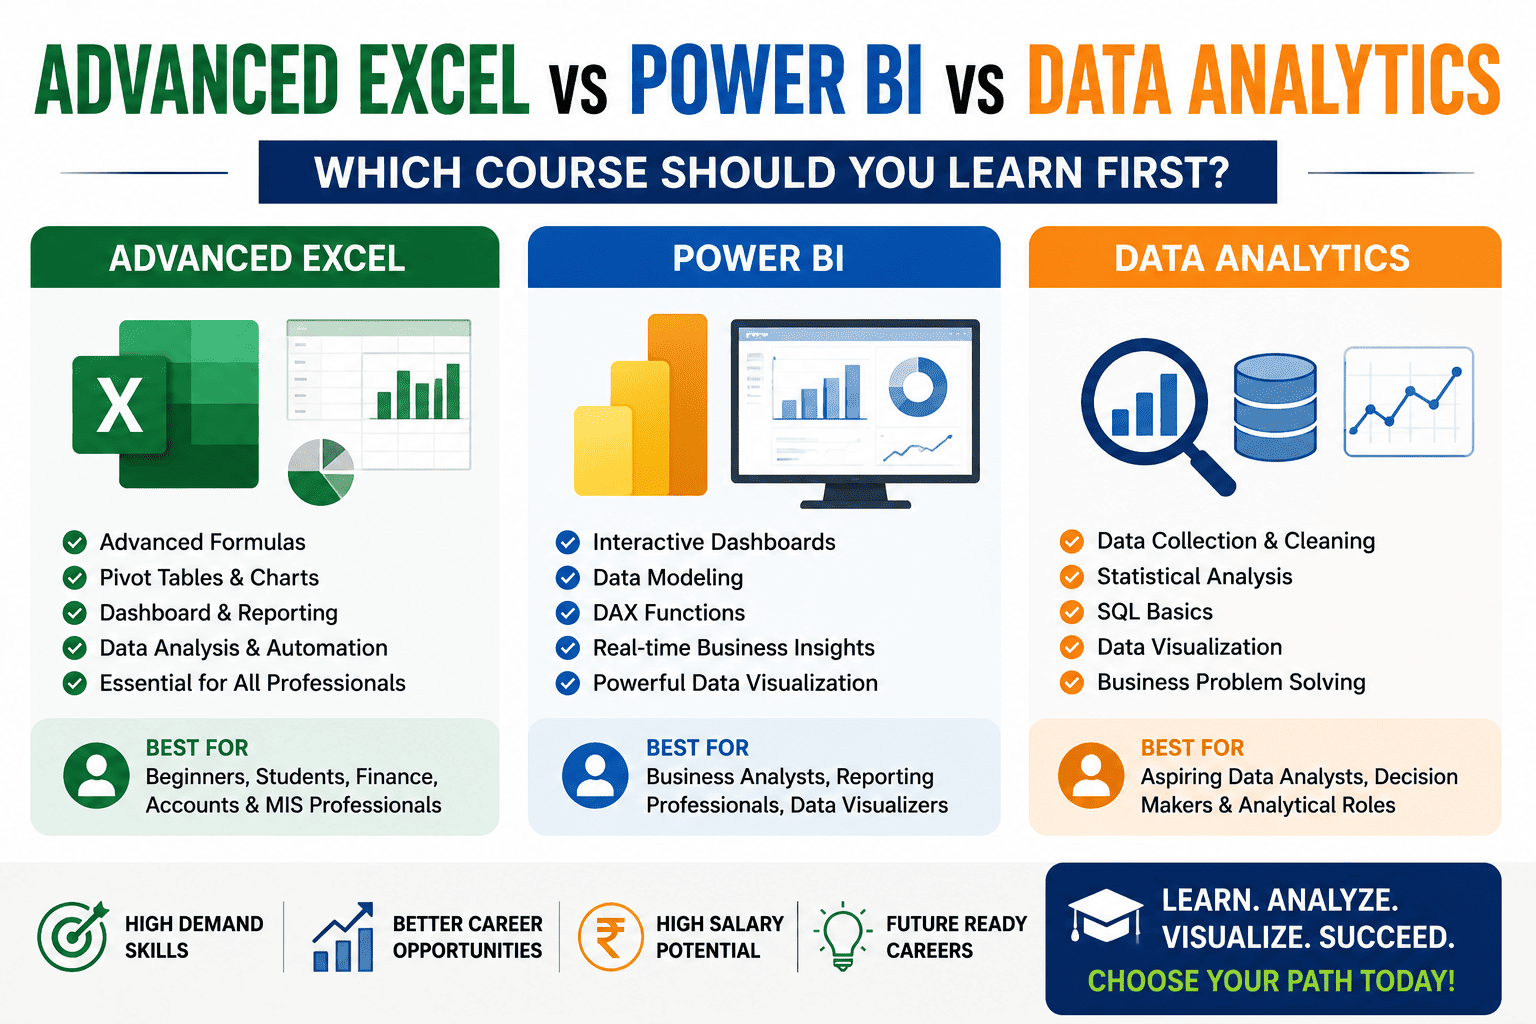
What is Advanced Excel?
Advanced Excel is an industry-standard spreadsheet tool used for calculations, reporting, automation, financial analysis, and business data management.
It is often the first software professionals learn before moving into business intelligence or data analytics.
Skills You’ll Learn
- Advanced Formulas
- Pivot Tables
- Pivot Charts
- Lookup Functions
- Power Query
- Conditional Formatting
- Dashboard Creation
- MIS Reporting
- Financial Reporting
- Data Cleaning
Best For
- Beginners
- Commerce Students
- Finance Professionals
- Accountants
- MIS Executives
- HR Professionals
- Office Executives
What is Power BI?
Power BI is Microsoft’s Business Intelligence platform used to transform raw data into interactive dashboards and visual reports.
It connects data from multiple sources and enables organizations to make faster, data-driven decisions.
Skills You’ll Learn
- Data Modeling
- Power Query
- DAX Functions
- Dashboard Development
- Interactive Reports
- KPI Dashboards
- Data Visualization
- Business Intelligence
Best For
- Data Analysts
- Business Analysts
- Financial Analysts
- Reporting Professionals
- BI Developers
What is Data Analytics?
Data Analytics is the process of collecting, cleaning, analyzing, interpreting, and presenting data to solve business problems and support strategic decision-making.
Unlike Excel or Power BI, Data Analytics is a broader field that combines analytical thinking with multiple tools and techniques.
Skills You’ll Learn
- Data Cleaning
- Data Analysis
- Statistics
- Business Analytics
- Data Visualization
- SQL Basics
- Excel
- Power BI
- Dashboard Development
- Business Reporting
Best For
- Data Analysts
- Business Analysts
- Analytics Professionals
- Decision Support Teams
- Finance Analysts
Quick Comparison
| Feature | Advanced Excel | Power BI | Data Analytics |
|---|---|---|---|
| Learning Difficulty | Easy | Medium | Medium–Advanced |
| Best For | Beginners | Reporting Professionals | Analytical Careers |
| Dashboard Creation | ⭐⭐⭐⭐ | ⭐⭐⭐⭐⭐ | ⭐⭐⭐⭐⭐ |
| Automation | ⭐⭐⭐⭐ | ⭐⭐⭐⭐ | ⭐⭐⭐⭐⭐ |
| Data Visualization | ⭐⭐⭐ | ⭐⭐⭐⭐⭐ | ⭐⭐⭐⭐⭐ |
| Career Growth | High | Very High | Excellent |
| Industry Demand | High | Very High | Extremely High |
Course Comparison at a Glance
Course Duration
| Course | Typical Duration |
|---|---|
| Advanced Excel | 1–2 Months |
| Power BI | 1–2 Months |
| Data Analytics | 4–8 Months |
Career Opportunities
After Advanced Excel
Popular job roles include:
- MIS Executive
- Reporting Executive
- Accounts Executive
- Financial Executive
- Operations Executive
- HR Executive
- Office Executive
Average Salary
₹3–6 LPA
After Power BI
Popular job roles include:
- Power BI Developer
- BI Executive
- Reporting Analyst
- Business Intelligence Analyst
- Dashboard Developer
- Financial Analyst
Average Salary
₹5–9 LPA
After Data Analytics
Popular job roles include:
- Data Analyst
- Business Analyst
- Financial Analyst
- Data Visualization Analyst
- Operations Analyst
- Marketing Analyst
- Product Analyst
Average Salary
₹6–12 LPA
Skills Comparison
Advanced Excel
- Advanced Formulas
- Pivot Tables
- Charts
- Dashboards
- Power Query
- Reporting
- Automation
Power BI
- Data Modeling
- DAX
- Interactive Dashboards
- Visual Analytics
- Data Transformation
- Business Intelligence
Data Analytics
- Excel
- SQL
- Power BI
- Statistics
- Data Visualization
- Business Intelligence
- Problem Solving
- Business Reporting
Industry Demand
Professionals with these skills are hired by:
- Banking & Financial Services
- IT Companies
- Healthcare
- Retail
- Manufacturing
- Logistics
- E-commerce
- Consulting Firms
- Insurance Companies
- Government Organizations
- Startups
- Multinational Companies (MNCs)
Salary Comparison
| Experience | Advanced Excel | Power BI | Data Analytics |
|---|---|---|---|
| Freshers | ₹3–5 LPA | ₹5–7 LPA | ₹6–8 LPA |
| 2–5 Years | ₹5–8 LPA | ₹7–12 LPA | ₹8–15 LPA |
| Experienced | ₹8–15 LPA | ₹12–18 LPA | ₹15–25+ LPA |
Professionals who combine all three skills often receive higher salary packages and broader career opportunities.
Which Course Should You Learn First?
Choose Advanced Excel If:
- You’re a beginner.
- You want to build strong spreadsheet and reporting skills.
- You work in finance, accounting, HR, or operations.
- You want a quick, job-oriented skill.
Choose Power BI If:
- You already know Excel basics.
- You want to create interactive dashboards.
- You’re interested in business intelligence and reporting.
- You enjoy working with data visualization.
Choose Data Analytics If:
- You want a long-term career in analytics.
- You enjoy solving business problems using data.
- You’re interested in business intelligence and decision-making.
- You’re comfortable learning multiple tools.
Recommended Learning Path
For beginners, the most effective roadmap is:
Step 1
Learn Advanced Excel
- Spreadsheet fundamentals
- Formulas
- Reporting
- Dashboards
Step 2
Learn Power BI
- Data modeling
- Interactive dashboards
- Business intelligence
Step 3
Learn Data Analytics
- SQL
- Statistics
- Data visualization
- Business analysis
- Real-world projects
This sequence builds a strong foundation and makes advanced analytical concepts easier to understand.
Future Scope in 2026
The demand for professionals with analytical skills continues to grow as organizations increasingly adopt AI, automation, and business intelligence platforms.
Professionals with expertise in Advanced Excel, Power BI, and Data Analytics can explore careers in finance, consulting, marketing, healthcare, logistics, manufacturing, retail, and technology.
Combining these skills also prepares you for advanced learning in AI, machine learning, predictive analytics, and data science.
Benefits of Learning All Three
- Better job opportunities
- Higher salary potential
- Strong analytical skills
- Practical business knowledge
- Improved decision-making
- Dashboard expertise
- Business intelligence capabilities
- Future-ready career profile
Frequently Asked Questions (FAQs)
1. Which course should I learn first: Advanced Excel, Power BI, or Data Analytics?
If you’re a beginner, start with Advanced Excel. It provides the foundation for reporting and data handling. Once you’re comfortable with Excel, progress to Power BI for visualization and dashboards, followed by Data Analytics to develop advanced analytical and problem-solving skills.
2. Is Power BI better than Advanced Excel?
Power BI offers more advanced data visualization and business intelligence features, while Advanced Excel remains essential for calculations, reporting, and everyday business tasks. Both complement each other and are widely used together.
3. Is Data Analytics difficult to learn?
Data Analytics requires logical thinking and an interest in working with data, but it becomes much easier if you already understand Advanced Excel and Power BI.
4. Which course offers the highest salary?
Data Analytics generally offers the highest salary potential, followed by Power BI. However, professionals who possess expertise in all three areas are often the most competitive in the job market.
5. Can I learn Power BI without Excel?
Yes, but having a good understanding of Excel makes learning Power BI easier and helps you understand business reporting concepts more effectively.
6. Which industries hire professionals with these skills?
Banking, finance, IT, healthcare, retail, manufacturing, logistics, insurance, consulting, e-commerce, and multinational companies all actively recruit professionals with Excel, Power BI, and Data Analytics expertise.
7. Is coding required for Data Analytics?
Entry-level Data Analytics courses generally focus on Excel, SQL, Power BI, statistics, and visualization. Basic SQL is commonly included, but extensive programming knowledge is not mandatory for beginners.
8. Why choose an Advanced Excel, Power BI, or Data Analytics course in Ahmedabad?
Ahmedabad has a rapidly growing ecosystem of finance, IT, analytics, and manufacturing companies. Industry-focused training, practical projects, and government-recognized certification can help learners build job-ready skills and improve career opportunities.
Conclusion
Choosing between Advanced Excel, Power BI, and Data Analytics depends on your current skill level and long-term career goals. Advanced Excel is the ideal starting point for beginners, providing essential skills in reporting, formulas, dashboards, and data management. Power BI builds on that foundation by enabling interactive data visualization and business intelligence. Data Analytics expands your capabilities further by combining analytical thinking, business problem-solving, and multiple tools into a comprehensive career path.
Instead of viewing these courses as alternatives, consider them as complementary stages of professional growth. By following the learning path of Advanced Excel → Power BI → Data Analytics, you develop practical business skills, analytical expertise, and visualization capabilities that are highly valued across industries. This combination prepares you for rewarding careers in finance, business intelligence, consulting, operations, and data analytics, making you future-ready for the evolving job market in 2026.